Base Wallet Activity: January 20 - February 7, 2026
Our first on-chain data report from Base: 1,161 tracked swaps, 69 charted trades, and an 87% win rate across monitored wallets. Featuring top trades and token trends.
Welcome to the first Base wallet activity report. This is a new series where we look at real trade data from wallets tracked on Ramaris to surface patterns, standout trades, and shifts in on-chain behavior.
This isn’t about recommending trades. It’s about giving you a data-informed view of what actually happened on Base so you can refine your own research.
This inaugural report covers January 20 through February 7, 2026 — our first three weeks of tracked data.
The Numbers
| Metric | Value |
|---|---|
| Tracked swaps | 1,161 |
| Charted trades | 69 |
| Unique tokens traded | 50 |
| Win rate (profitable trades) | 87% |
| Average profit on charted trades | +700% |
| Median profit | +149% |
| Wallets monitored | 412 |
| Active strategies | 65 |
The 87% win rate across 69 charted trades is striking — but context matters. These are trades from wallets that users selected specifically because they showed strong track records. The average is skewed by a few outlier gains. The median profitable trade was +149%, and 9 trades (13%) ended at a loss.
Top Trades
These are the standout trades from our first few weeks of tracking. Each chart below is auto-generated from real on-chain data — candle prices, trade timing, and profit percentage.
Gauntlet: +969%
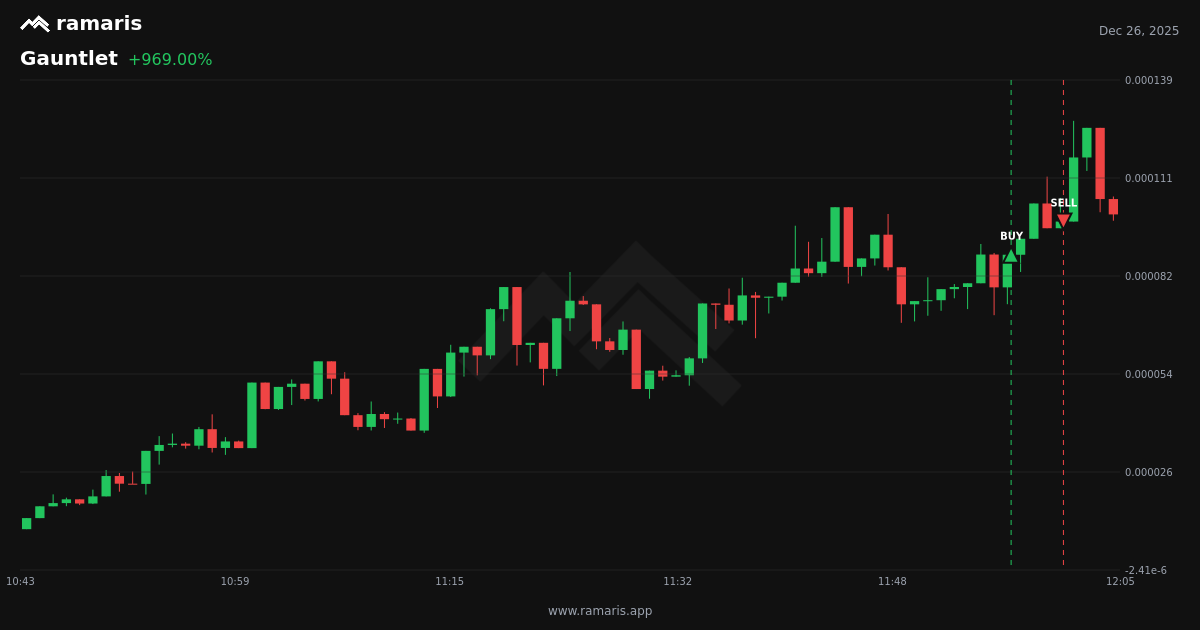
A textbook early entry. The tracked wallet bought Gauntlet early in its price discovery phase and held through 83 candle periods of steady appreciation. The chart shows a clean uptrend with relatively shallow pullbacks — the kind of price action that suggests genuine buying pressure rather than a single pump.
TERRA: +4,062%
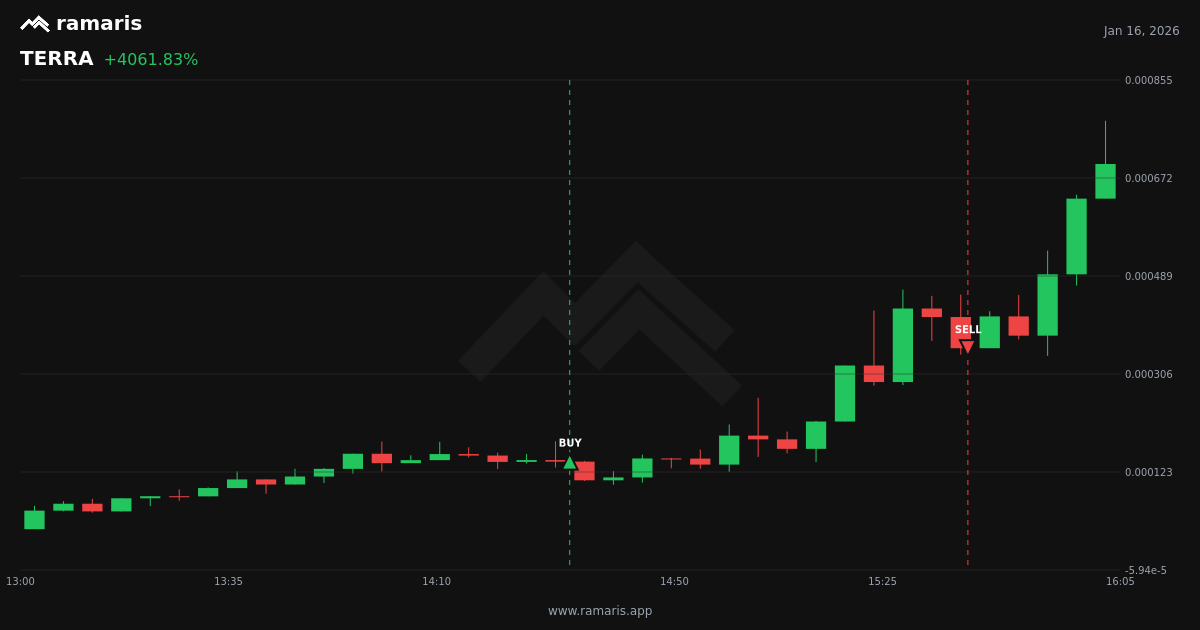
A massive gain. This wallet caught TERRA near its bottom and rode a sustained 38-candle rally. Trades like this typically come from wallets that monitor new token launches closely and size positions small enough that they can afford the high failure rate.
BPENGU: +676%
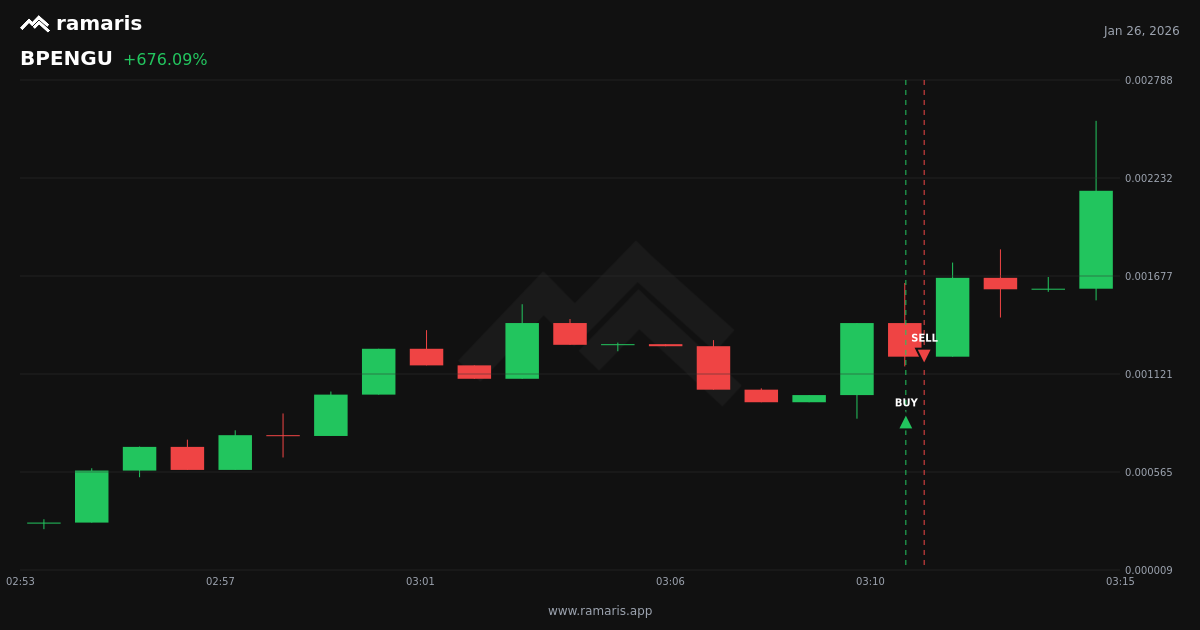
A well-timed dip buy. The wallet entered BPENGU during a sharp pullback near the bottom of a short-term correction, then watched the price recover and push higher. Buying dips in tokens that have already shown strength is a pattern we see frequently in high-performing wallets — it requires conviction and the discipline to buy when the chart looks worst.
GRUMPYCAT: +783%
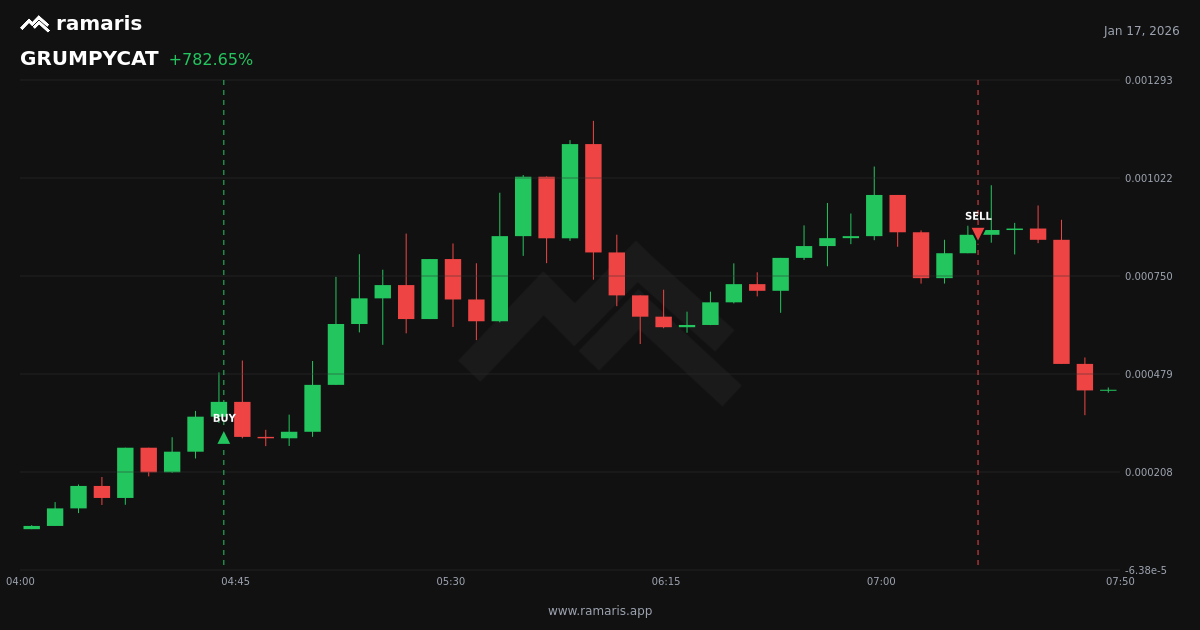
GRUMPYCAT appeared across multiple tracked wallets (3 separate charted trades). When several unrelated wallets converge on the same token, it’s one of the stronger signals in wallet tracking. The average return across all three GRUMPYCAT trades was +303%.
spindl: +178%
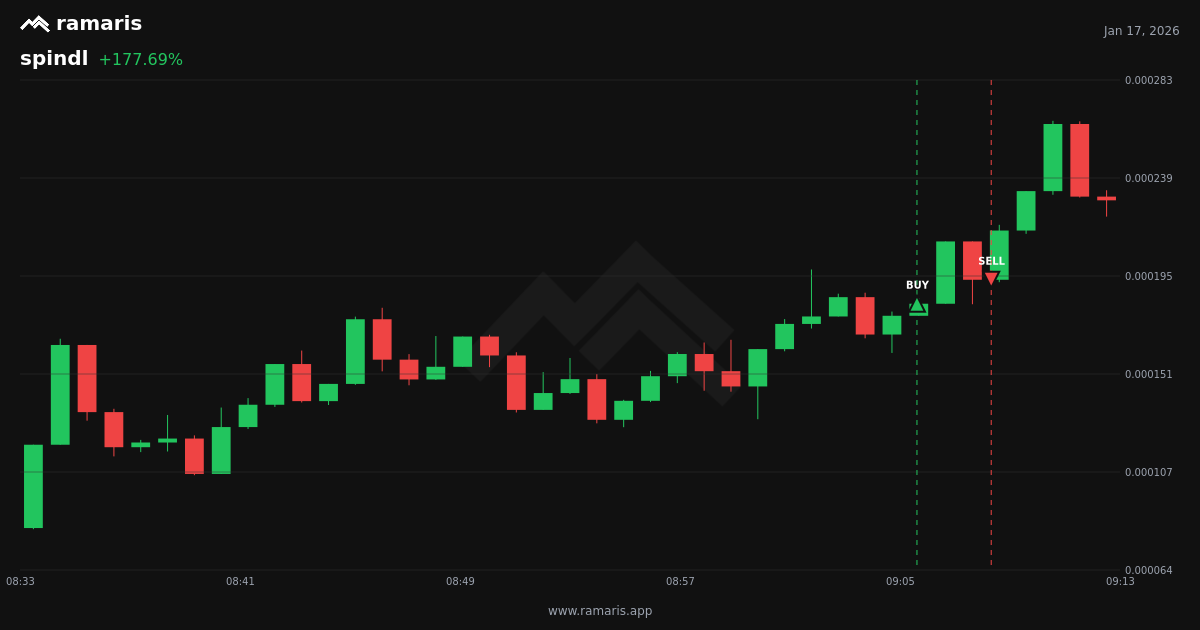
A steady uptrend with a well-placed entry. The wallet bought spindl during a brief dip in an otherwise consistent climb, then sold into strength a few candles later. Not the flashiest return on this list, but the cleanest execution — the kind of trade that compounds over time when repeated consistently across multiple positions.
Token Trends
The most-traded tokens across tracked wallets during this period:
| Token | Charted Trades | Avg Profit |
|---|---|---|
| FIREBALL | 6 | +4,674% |
| PsyopAnime | 4 | +185% |
| FROG | 3 | +252% |
| GRUMPYCAT | 3 | +303% |
| HYDX | 3 | -4% |
FIREBALL was the standout with 6 separate charted trades and an average gain of +4,674%. That average is heavily skewed by one 28,125% outlier — but even excluding it, the remaining five FIREBALL trades were profitable.
HYDX is the cautionary tale. Three charted trades averaging -4% — a reminder that popular tokens among tracked wallets don’t always produce gains. When multiple wallets trade the same token and the result is flat or negative, it suggests the opportunity window was narrow or already closed.
Patterns Worth Watching
Memecoin Dominance
Of the 50 unique tokens traded during this period, the majority were memecoins and low-cap tokens on Base. This is consistent with the broader Base ecosystem, where wallet tracking is most valuable — these tokens move fast, information asymmetry is high, and the wallets that find them early can generate outsized returns.
Multi-Wallet Convergence
GRUMPYCAT and FROG both showed up across multiple unrelated wallets. Multi-wallet convergence on the same token within a short timeframe is one of the highest-conviction signals available through wallet tracking. It doesn’t guarantee anything, but it means different analytical approaches reached the same conclusion.
Holding Periods Vary Widely
The top trades ranged from 9-candle quick flips (FIREBALL) to 47-candle extended holds (GRUMPYCAT, spindl). There’s no single “right” holding period. The wallets with the best track records appear to adjust their timeframe based on the specific token and market conditions rather than following a fixed strategy.
How to Use This Data
-
Cross-reference with your strategies: Compare what your Ramaris signals showed you with the trades highlighted here. Are your tracked wallets catching similar opportunities?
-
Research convergence tokens: When multiple wallets trade the same token, explore it in Browse Wallets. Which wallets were involved? What’s their overall track record? For more on evaluating wallets, see How to Find Wallets Worth Following on Base.
-
Evaluate your filters: If your strategies missed active tokens like FIREBALL or GRUMPYCAT, consider whether your filter criteria are too narrow.
-
Study the charts: Each trade chart linked above shows real price action with exact entry timing. Use them to understand how profitable wallets time their entries — not just what they bought. These patterns align with the 5 On-Chain Patterns That Distinguish Consistent Traders.
Looking Ahead
A few things to watch going forward:
- Whether FIREBALL’s momentum sustains or if this period was the peak
- GRUMPYCAT’s trajectory after multi-wallet convergence
- New token launches on Base and which tracked wallets are first movers
- Whether the 87% win rate holds as we track more data — or if this initial period was unusually favorable
We’ll be back next week with fresh data. The best way to stay on top of Base wallet activity is to set up your own monitoring strategies and let the data come to you.
This report is the first in a weekly series. Follow @ramaris_app for updates.
All data sourced from Ramaris platform analytics and public Base blockchain data. For informational purposes only. Not financial advice. Past wallet performance does not predict future results.
Track smart money wallets on Base
Real-time alerts, PnL history, sybil filtering. Free to start.
Start tracking wallets